Opportunity Manager ROI Dashboard
The Opportunity Manager ROI dashboard (pictured below) provides a detailed overview of the momentum, velocity, and comparative deal performance of your organization's opportunity-based selling activities. The dashboard can be installed as an unmanaged package is customizable.
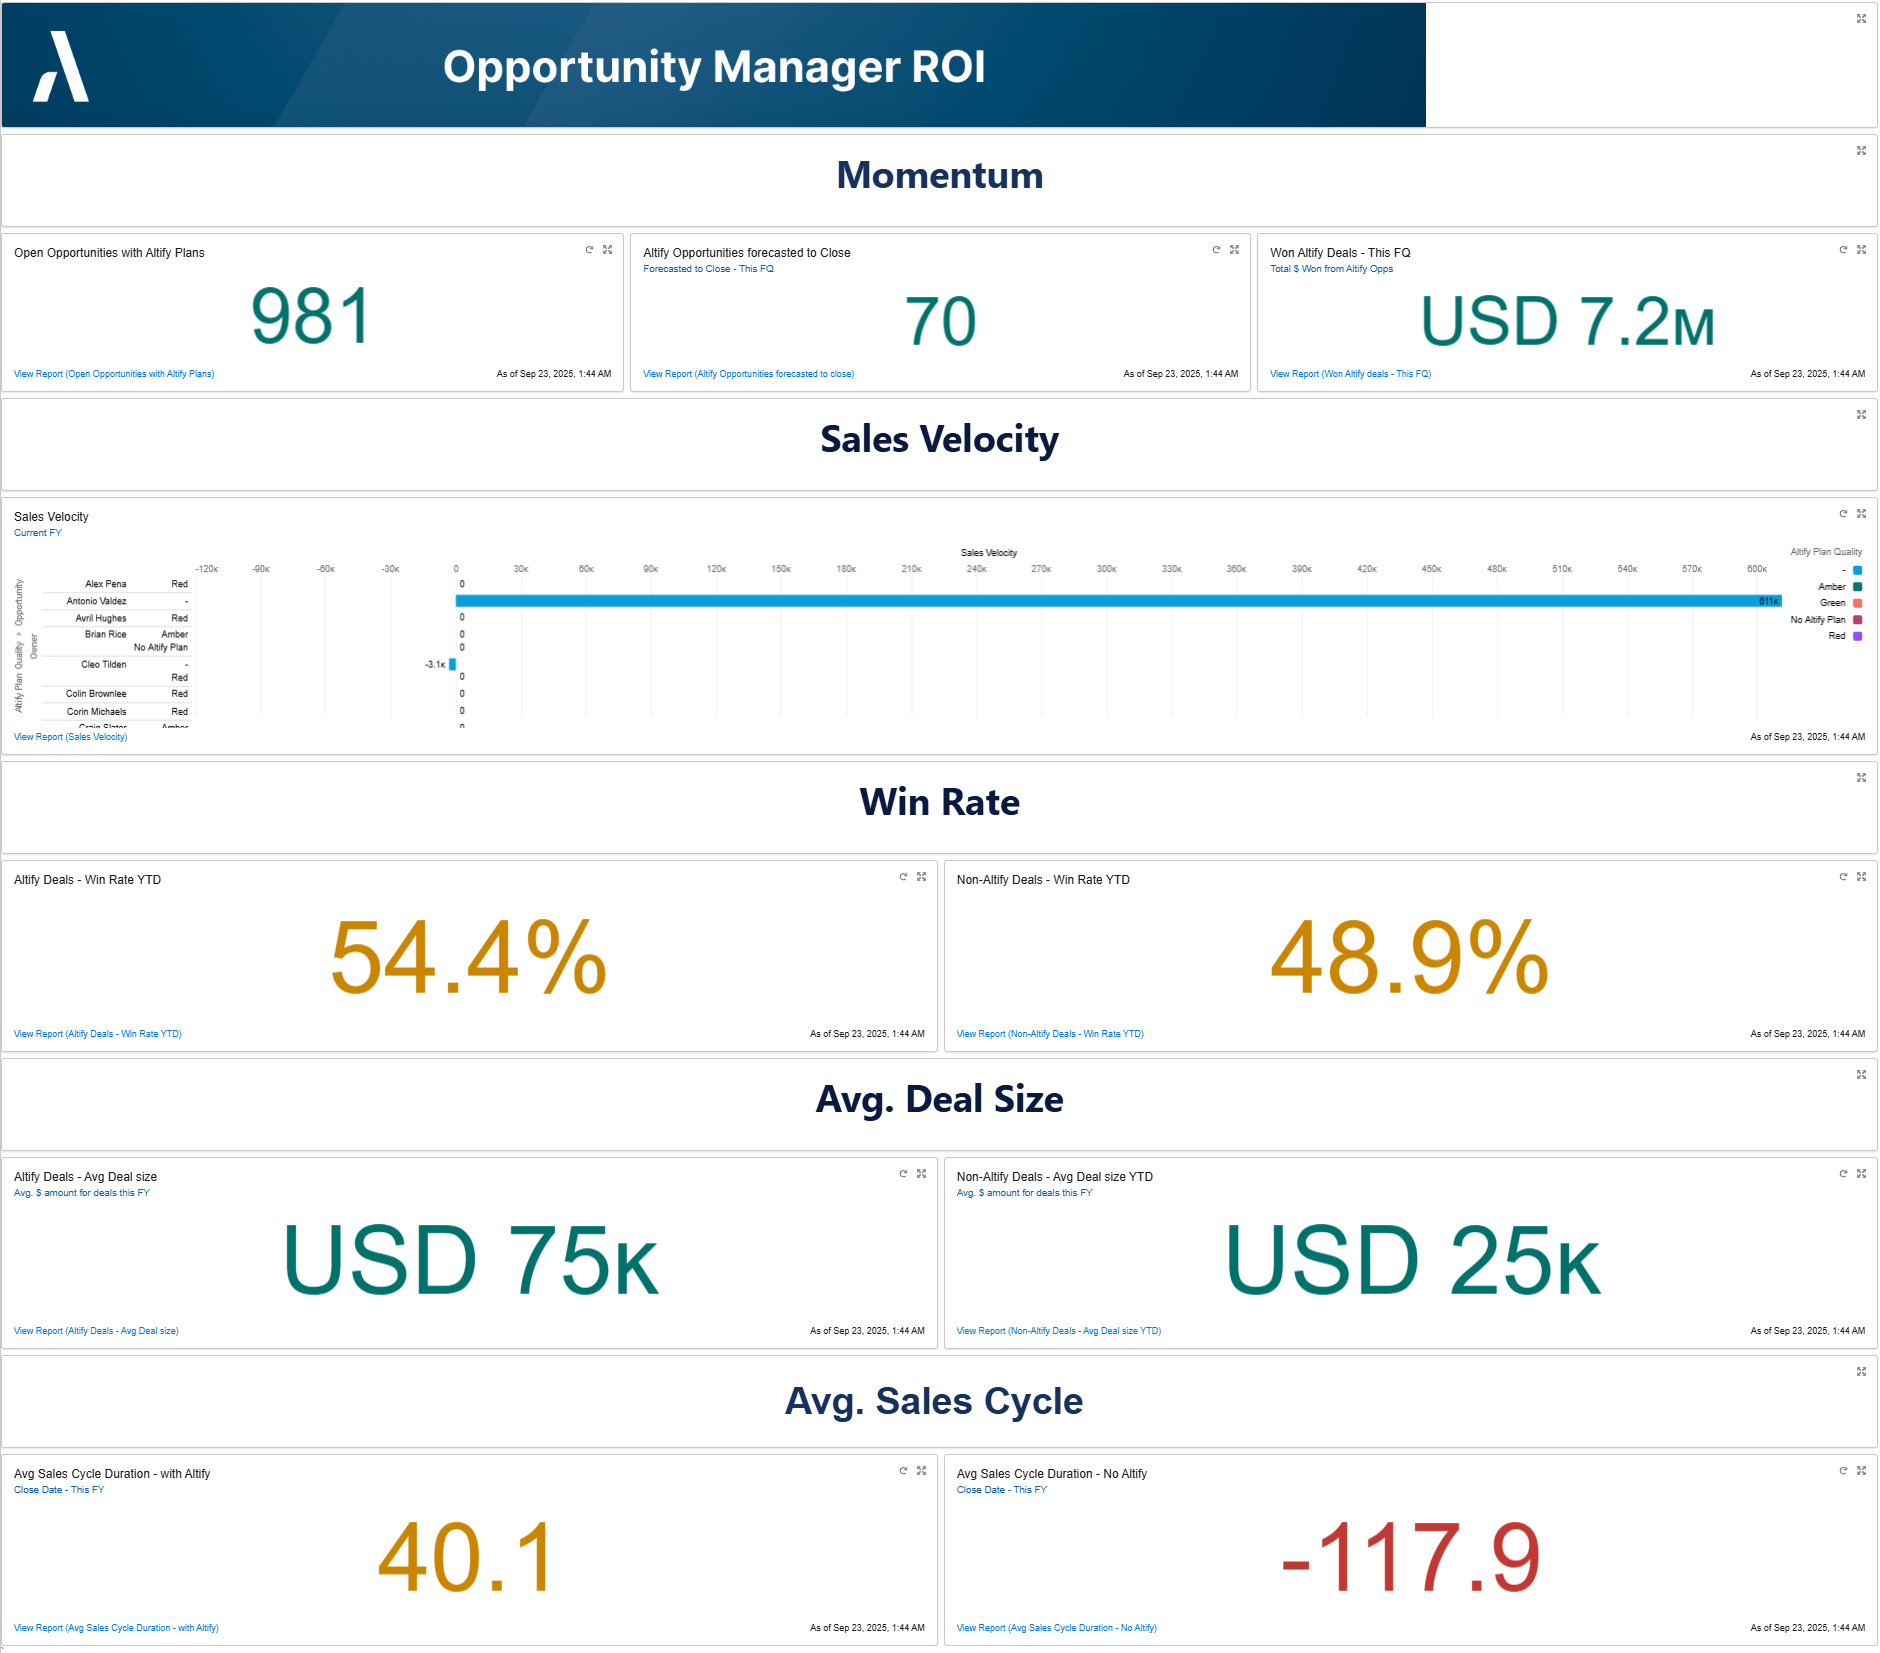
As displayed above, the dashboard comprises five sections:
-
Momentum: Measures current opportunity management activity and forward-looking pipeline growth. It comprises the following reports (click a report for further detail):
-
'Open Opportunities with Altify Plans': total number of active opportunities managed with Altify.
-
'Altify Opportunities Forecasted to Close': pipeline value of Altify opportunities forecasted to close in the current period.
-
'Won Altify Deals – This FQ' – total revenue from Altify-managed opportunities closed/won this fiscal quarter.
-
-
Sales Velocity: Highlights the speed at which opportunities move through the pipeline. It comprises the following reports (click a report for further detail):
-
'Sales Velocity' – compares the average time to close for opportunities with vs. without Altify plans.
-
-
Win Rate: Shows the effectiveness of opportunity management in converting deals. It comprises the following reports (click a report for further detail):
-
'Altify Deals – Win Rate YTD': win rate for opportunities managed with Altify.
-
'Non-Altify Deals – Win Rate YTD': win rate for opportunities not managed with Altify.
-
-
Avg. Deal Size: Measures the value of deals managed with vs. without Altify. It comprises the following reports (click a report for further detail):
-
'Altify Deals – Avg Deal Size': average revenue amount for Altify-managed deals.
-
'Non-Altify Deals – Avg Deal Size': average revenue amount for non-Altify-managed deals.
-
-
Avg. Sales Cycle: Highlights differences in deal duration between planned and unplanned opportunities. It comprises the following reports (click a report for further detail):
-
'Avg Sales Cycle Duration – With Altify': average sales cycle (in days) for Altify-managed opportunities.
-
'Avg Sales Cycle Duration – No Altify': average sales cycle (in days) for non-Altify-managed opportunities.
-
For guidance on installing the dashboard, see Installing the Opportunity Manager ROI Dashboard.