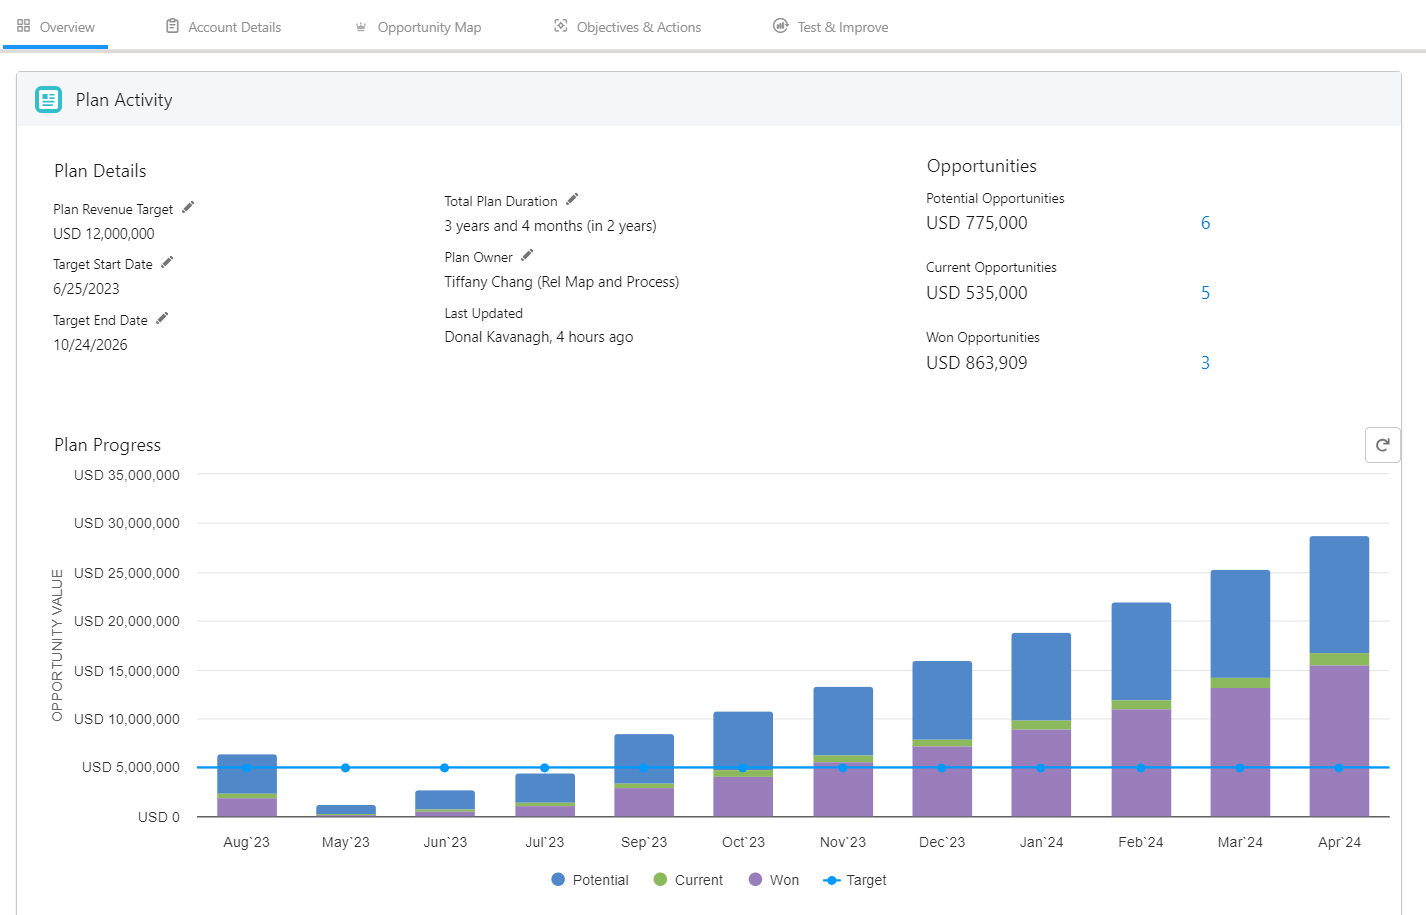
The Plan Activity panel on the Plan Overview page gives you key activity-related details.
Plan Revenue Target
This is the sum of the revenue targets in each of the plan's periods.
You can click the pencil icon to go to Plan Settings and make adjustments to the plan's targets.
Target Start Date, Target End Date
The start date of the first plan period, and the end date of the last plan period.
You can click the pencil icon of one of these dates to go to Plan Settings and make adjustments to the plan's target dates.
Total Plan Duration
The total time from the start of the first plan period to the end of the last plan period. In brackets, you also see the amount of time left until the end of the last plan period.
You can click the pencil icon to go to Plan Settings and make adjustments to the plan's targets.
Plan Owner
An Account Manager plan has a single owner. Initially, this is the user who creates the plan, but it can be changed to a different user by any user who has Read-Write access to the plan.
The plan owner can't be deleted from the plan's list of team members.
You can click the pencil icon to go to Plan Settings and change the plan owner.
Last Updated
This tells you who last updated the Account Manager plan, and how long ago.
Opportunity numbers and total amounts
The total amounts of potential, current, and won opportunities on the Account Manager plan, and how many of them there are (click this number to go to the plan's Opportunity Maps).
Tip: If there is a gap between the Current Opportunities value and the Plan Revenue Target, you should check that there are both Revenue and Business Development objectives (with actions) in progress for the account plan. For more information, see Objectives.
Plan Progress
This chart helps you to judge whether the Account Manager plan is being implemented effectively. It shows the summed values of the plan's potential, current, and won opportunities per month.
Note: If your Plan Progress chart is blank, it is probably because you either haven't added any opportunities to your opportunity map yet, or because the batch job ('Update Account Manager Plan Progress') that informs the chart is not in effect - please contact your Altify Administrator if this is the case.
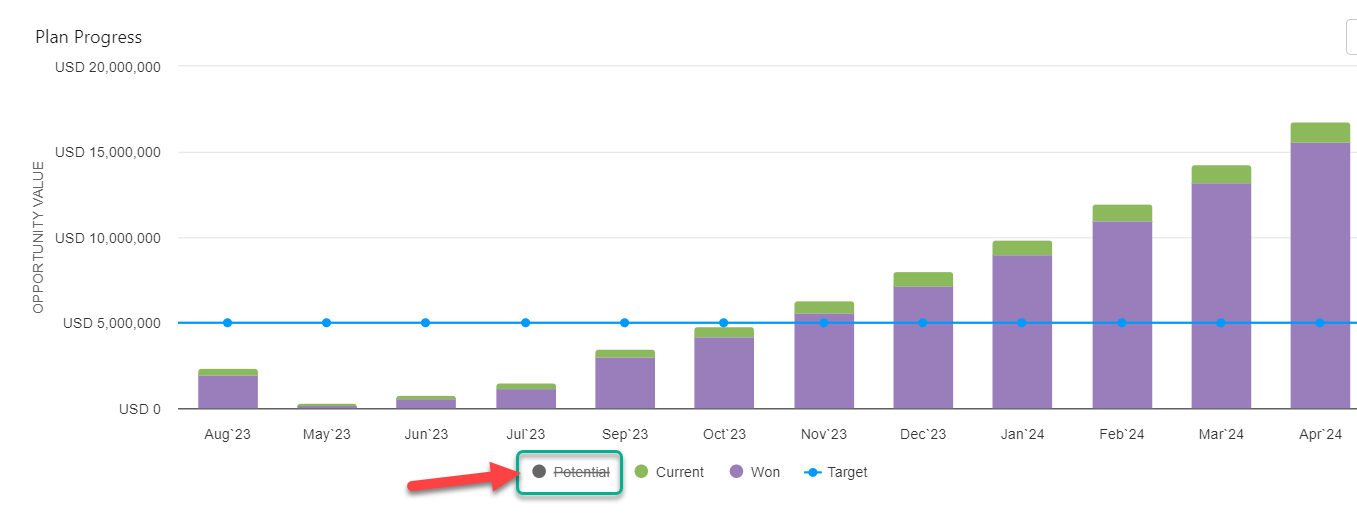
Filtering using the chart legend
You can filter out Potential, Current, or Won opportunities by clicking items in the chart legend - as shown in the example below, where potential opportunities have been filtered out of the chart.
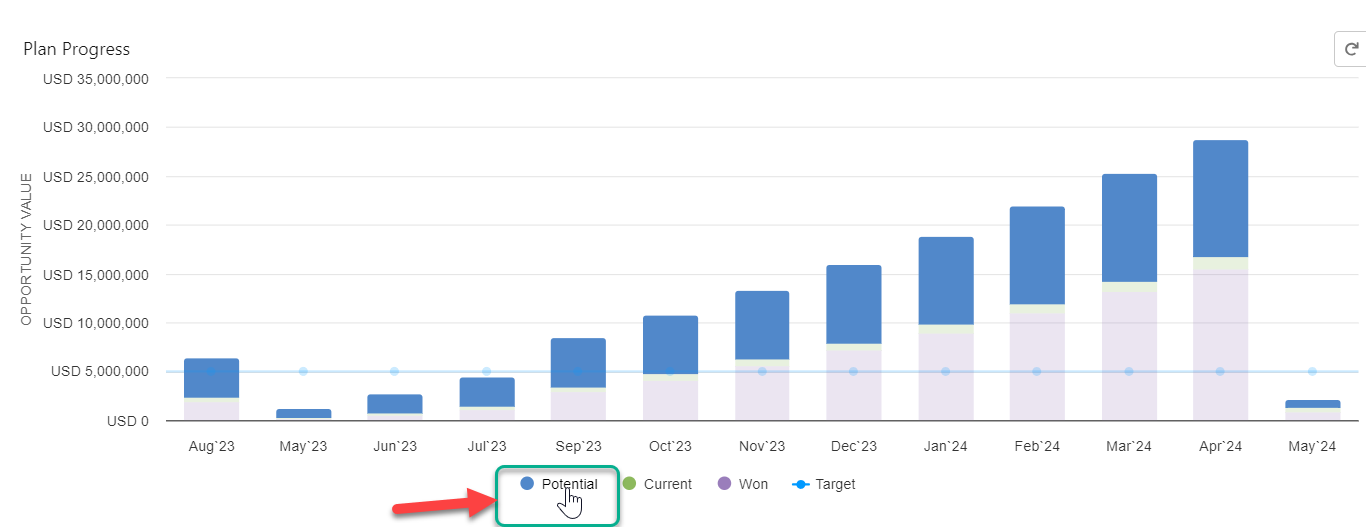
Hover your cursor over a legend item to focus on it in the chart (as shown in the example below where potential opportunities are in focus).
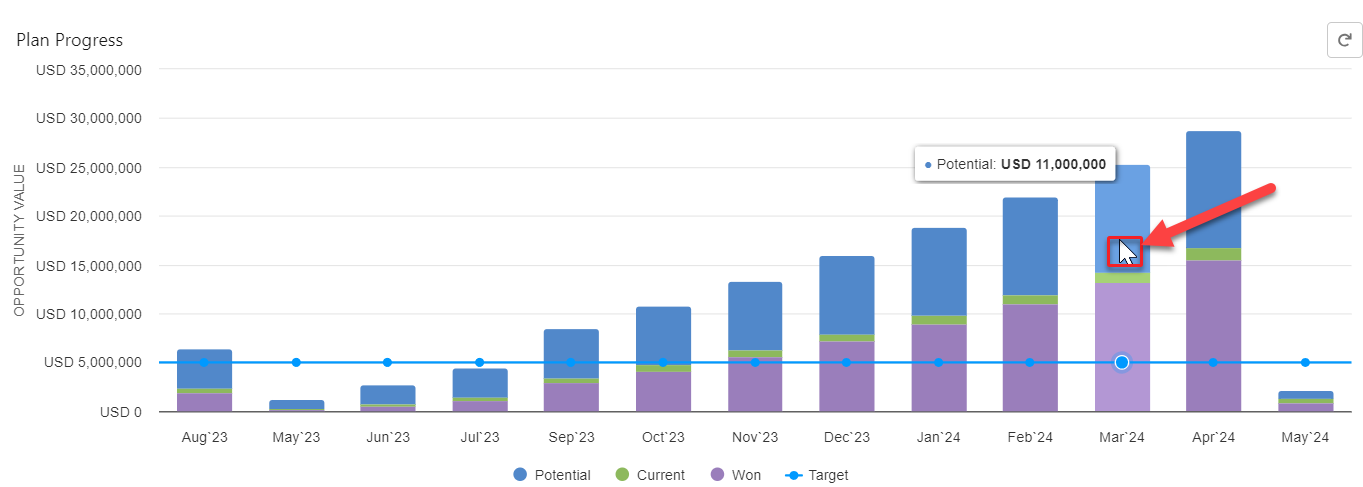
Viewing opportunity amount totals
Hover your cursor over the relevant section of a column to see the amount that it represents (as shown in the example below).
Opportunity values for the current month are automatically updated each day. Click the Refresh icon ![]() in the upper right corner of the chart to include any opportunities that have been added to the opportunity map today.
in the upper right corner of the chart to include any opportunities that have been added to the opportunity map today.
What does 'good' look like?
The value of a potential or current opportunity is reflected on the chart from the month in which it was added to the plan.
The value of a won opportunity is reflected on the chart from the month in which it was closed won. For example, if an opportunity with a closed won date in December is added in November, it is not reflected in the chart until December.
In a successful Account Manager plan, you should see the total value of your opportunities (potential, current, and won) trending upwards on the chart.
What does the blue line mean?
The blue line on the chart shows you how each month's opportunity amounts compare to the plan's overall revenue targets.
The line always shows the sum of the revenue targets for the current year and any previous years of the plan. (This is why you see a step in the blue line where the year changes.)