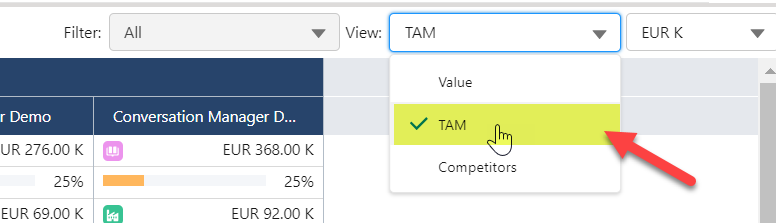
TAM View - Total Addressable Market
Switch the opportunity map View to TAM for an overview of your organization's market share for each row and solution.
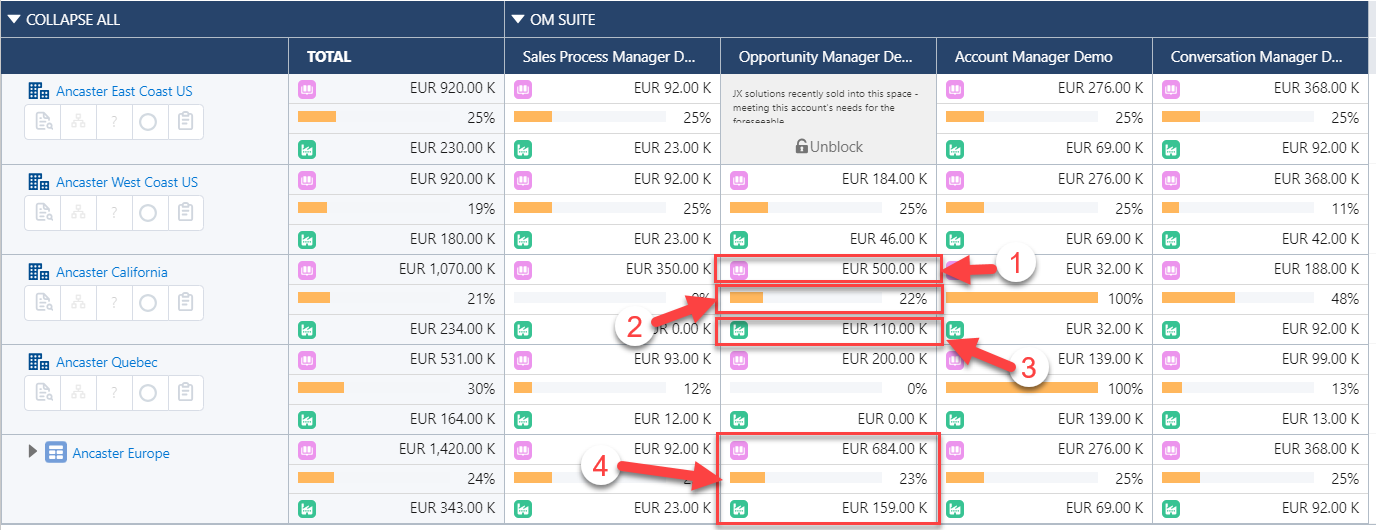
For each intersection, the TAM view shows:
-
Total Addressable Market (TAM)
 : The total size of the account/division's addressable market for the solution in question
In the example indicated below (see 1), a TAM of €500,000 exists for the solution 'Opportunity Manager Demo' in the account 'Ancaster California'.
-
The percentage of the TAM held by your company . This is represented by a progress bar and a % figure.
In the example indicated below (see 2), 22% of the Opportunity Manager Demo/Ancaster California TAM is currently held by the user's organization.
Switch to the Competitors view to see how much of each TAM is currently held by your competitors.
-
Your company's allocated share of the TAM
 expressed either as a currency value or a number of potentially sellable units.
In the example indicated below (see 3), €110,000 of sales have been achieved by the user's org in the Opportunity Manager Demo/Ancaster California TAM.
-
The above information totaled and averaged for all account and division rows within a roll up.
In the example indicated below (see 4), the above information is summarized for all rows within the 'Ancaster Europe' roll up.
Click into an intersection to view additional information about the specific TAM (share unallocated and competitor market share), or to update the information displayed. For more information, see Entering TAM and Competitor Information.