Adjusting the Display of an Opportunity Map
At the top of your opportunity map are a number of options to adjust how the map is displayed.
-
Freeze Panes to maintain the display of the account header column and solution header row when you scroll down or across the opportunity map.
-
Show a Plan Total row to display totals of opportunity amounts.
-
Expand or collapse solution families (if your admin has configured Account Manager to use solution families)
-
Show Legend to open a right hand panel that will help you identify the components of your opportunity map.
-
Filter the map to only show opportunities of a particular type or amount.
-
Create and access market info to understand what market share is available and who your competitors are.
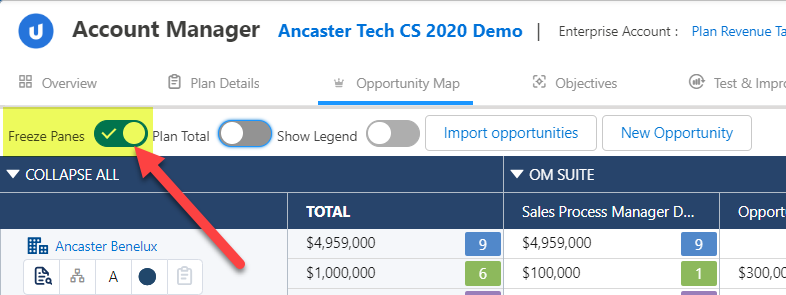
Freeze panes
Enable the Freeze Panes toggle in the top left (as shown below) if you want the row and solution headers remain static when you're scrolling. This helps you to see the context of a particular cell.
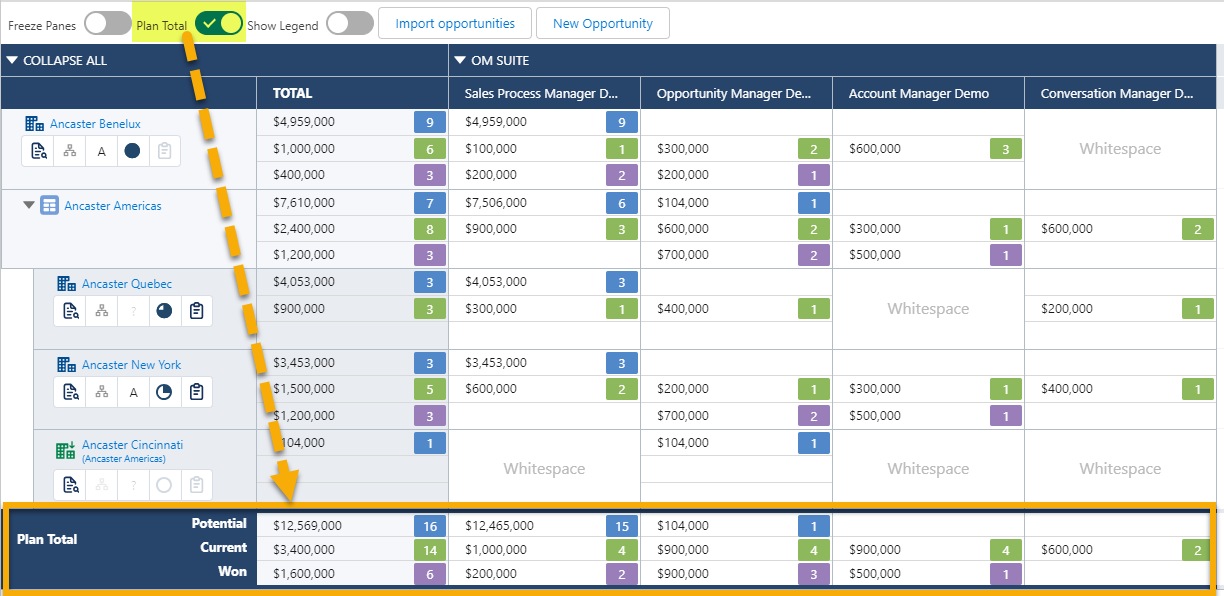
Show plan total
Enable the Plan Total toggle to roll up all the opportunity amounts in a single row at the bottom of the opportunity map.
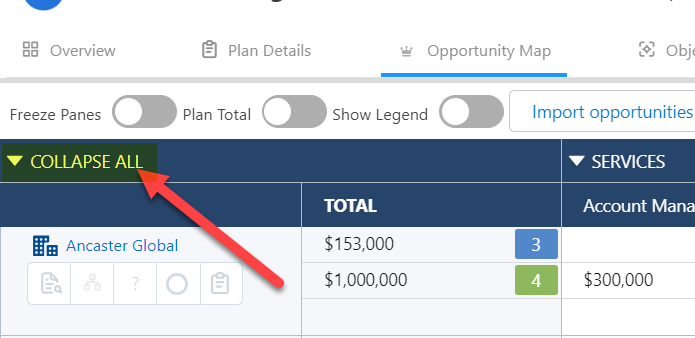
Expand/collapse solution families
If your organization applies solution family functionality (whereby solution columns in your opportunity maps are grouped according to 'solution families'), you can collapse solution families so that all the relevant opportunity amounts are totaled in a single column for each family.
-
Expand or collapse all solution families in the opportunity map.
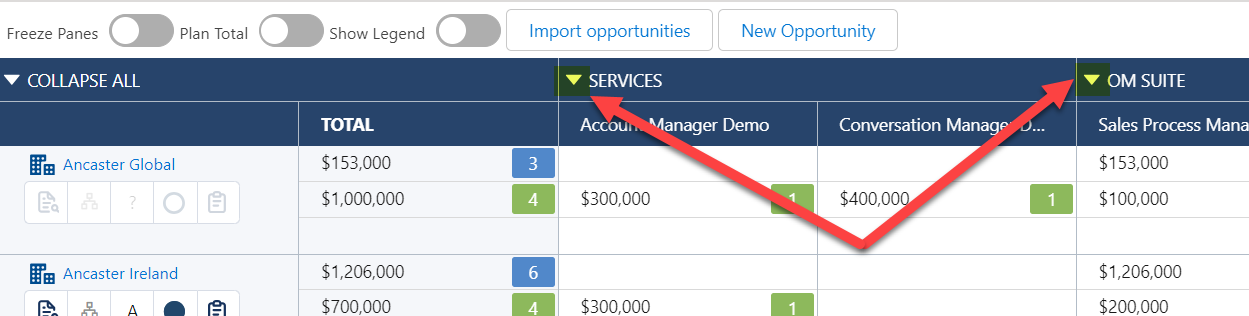
-
Expand or collapse a specific solution family in the opportunity map.
Show Legend
Activate the Show Legend toggle (indicated below) to open a right-hand panel that identifies all the components of your map.
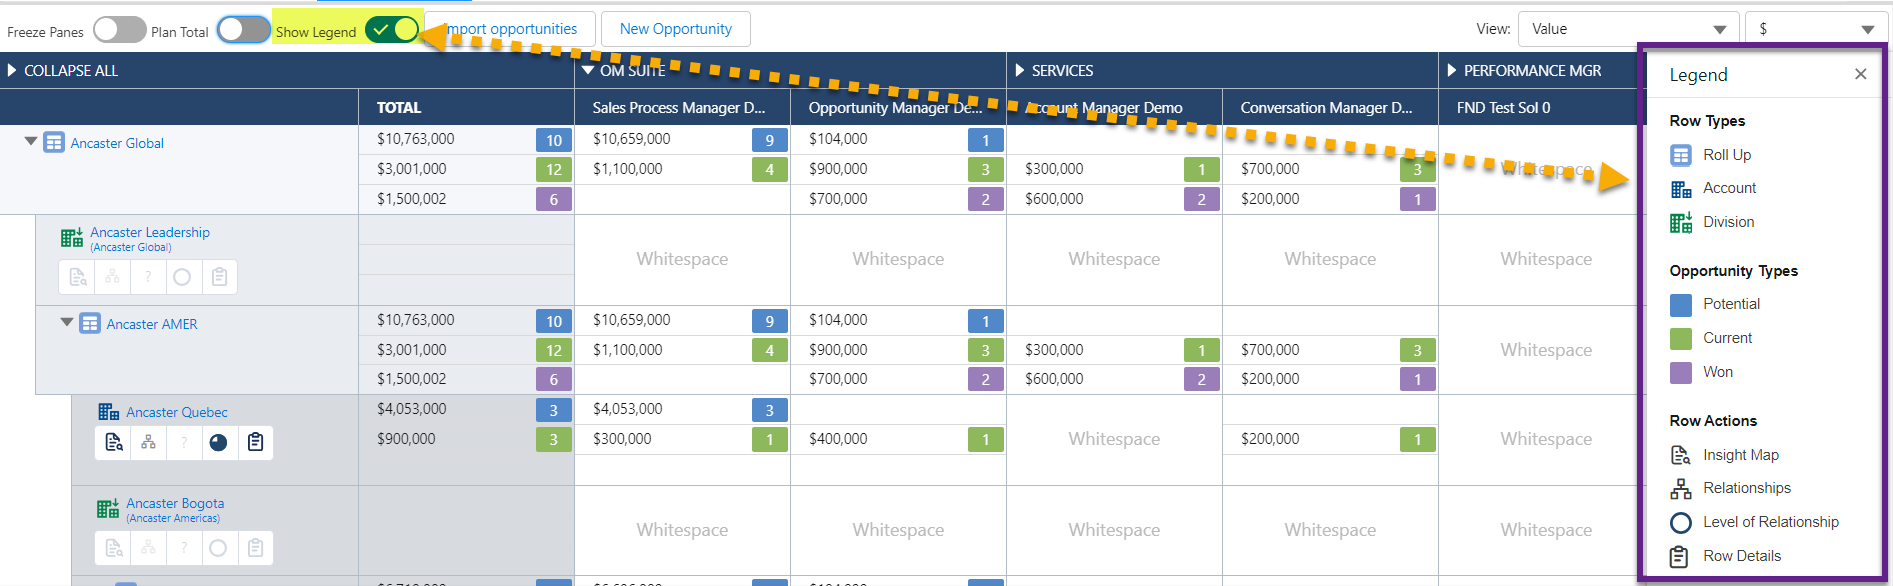
This is a useful tool for when you are you getting used to account planning on an opportunity map.
Filter the map
The Filter menu (highlighted in the example below) is only shown if your administrator has created opportunity map filters.
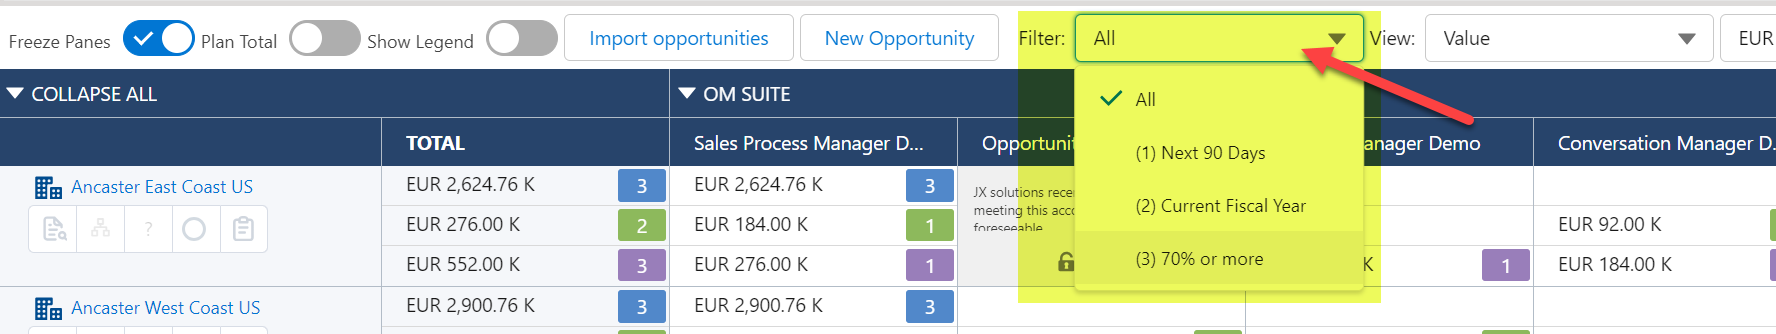
For more information, see Filtering the Opportunity Map.
Create and access market info
The View menu (highlighted in the example below) allows you to capture your company's market share and competitor information for every market in your map (each intersection representing an addressable market if it is not blocked).
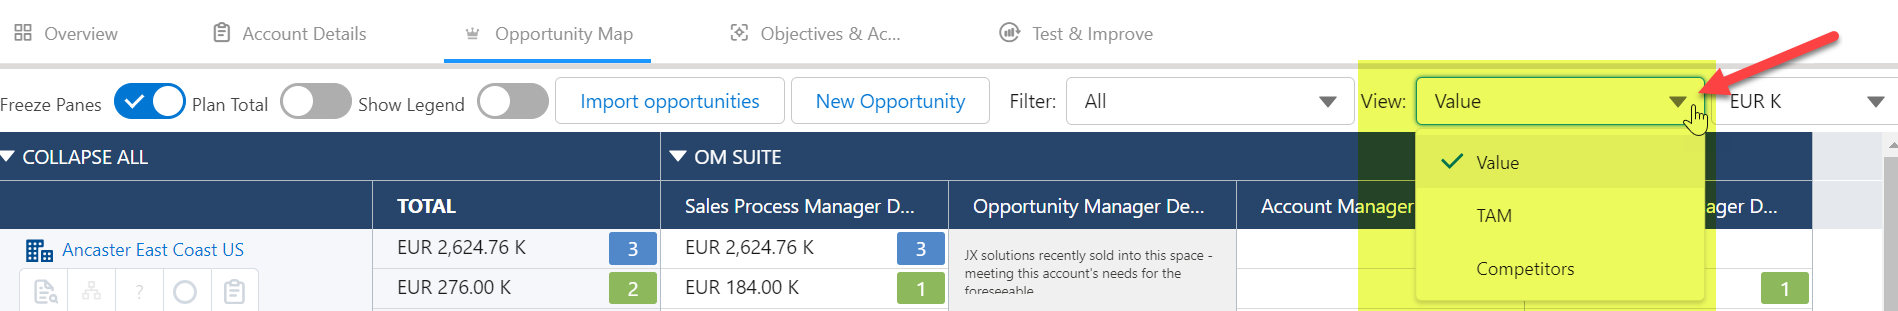
For more information, see Market Landscape.
Select an opportunity amount format
Use the menu on the far right above your opportunity map (highlighted in the image below) to format how opportunity maps are displayed.
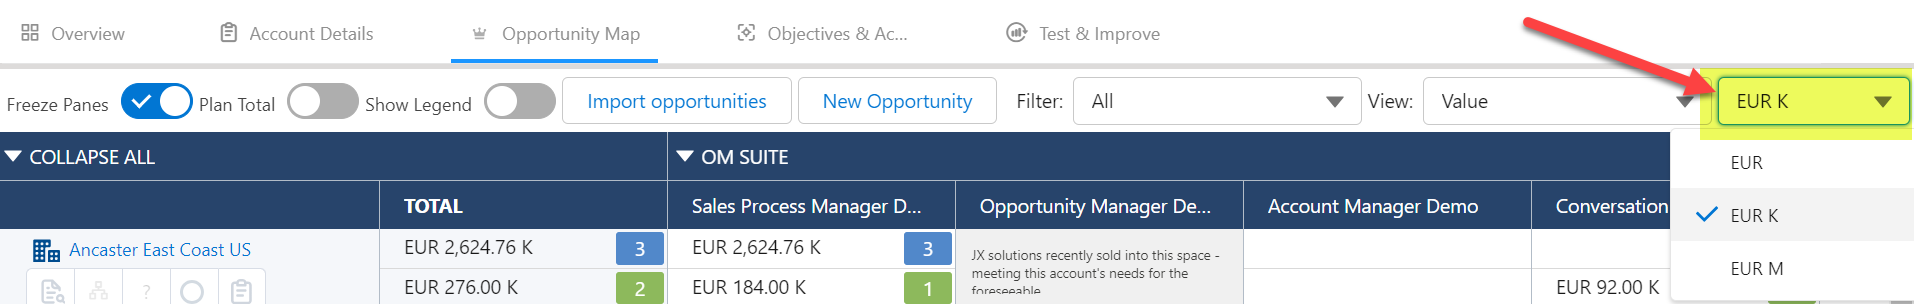
Opportunity amounts can be displayed in full, or rounded to the nearest thousand (K) or million (M). Amounts are rounded to two decimal points.